In the world of database management, having deep insights into query performance is crucial. For those using Azure Postgres, enabling PG_STAT_STATEMENTS is a game-changer. This powerful extension allows you to track and analyze every SQL statement executed by your database, providing invaluable data that can help you optimize performance and ensure your application runs smoothly. This blog will guide you through the process to enable PG_STAT_STATEMENTS extension in Azure Postgres environment.
Enabling extension
Azure PostgreSQL, a PaaS (Platform as a Service) offering managed by Microsoft, supports a limited set of extensions, but don’t worry—PG_STAT_STATEMENTS is one of them. If you’re wondering what other extensions are supported by Azure PostgreSQL, you can check the full list, here.
-
Navigate to Server Parameters in the Azure Portal:
In the Azure portal, go to the for “Settings” > “Sever Parameters”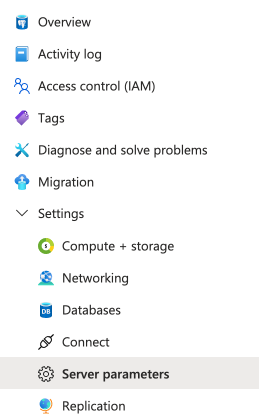
-
Search for Extensions:
In the search bar, type for “azure.extensions”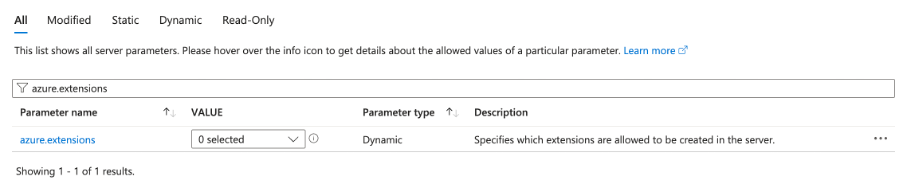
-
Select PG_STAT_STATEMENTS:
Find “PG_STAT_STATEMENTS” in the list of available extensions and toggle it on. Don’t forget to hit “Save” to apply the changes.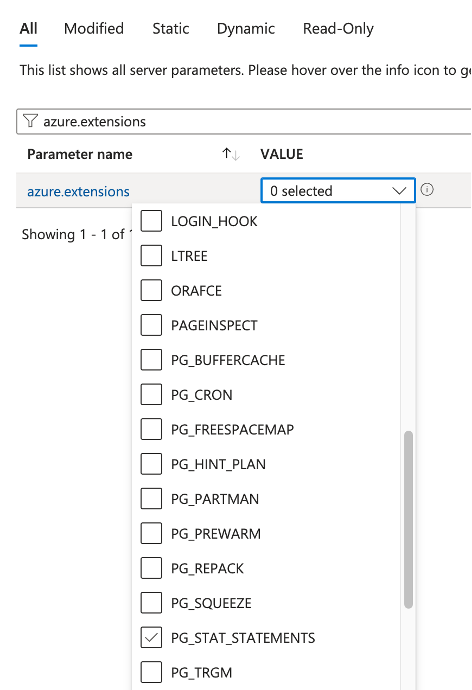
- Activate the Extension in Postgres:
After saving, log in to your Postgres instance with sysadmin and run the following command:1
create extension pg_stat_statements
- Query the Statistics:
Once the extension is created, you can start querying the statistics by executing:1
select * from pg_stat_statements
Useful Queries
Top Queries by Total Execution Time
Shows the top 10 queries with the highest total execution time.
1
2
3
4
5
6
7
8
9
10
SELECT
  query,
  calls,
  total_exec_time / 1000 AS total_seconds,
  mean_exec_time AS avg_ms,
  min_exec_time AS min_ms,
  max_exec_time AS max_ms
FROM pg_stat_statements
ORDER BY total_exec_time DESC
LIMIT 10;
Top Queries by Average Execution Time
Identifies the top 10 queries with the highest average execution time, which might be candidates for optimization.
1
2
3
4
5
6
7
8
9
10
SELECT
  query,
  calls,
  mean_exec_time AS avg_ms,
  total_exec_time / 1000 AS total_seconds,
  min_exec_time AS min_ms,
  max_exec_time AS max_ms
FROM pg_stat_statements
ORDER BY mean_exec_time DESC
LIMIT 10;
Top Queries by Planning Time
Identifies queries that spend a lot of time in the planning phase, which might be optimized with better indexes or query rewrites.
1
2
3
4
5
6
7
8
9
10
SELECT
  query,
  calls,
  total_plan_time / 1000 AS total_plan_seconds,
  mean_plan_time AS avg_plan_ms,
  total_exec_time / 1000 AS total_exec_seconds,
  mean_exec_time AS avg_exec_ms
FROM pg_stat_statements
ORDER BY total_plan_time DESC
LIMIT 10;
Longest Running Queries
Lists the top 10 longest-running queries by maximum execution time.
1
2
3
4
5
6
7
8
9
10
SELECT
  query,
  calls,
  max_exec_time AS max_ms,
  min_exec_time AS min_ms,
  mean_exec_time AS avg_ms,
  total_exec_time / 1000 AS total_seconds
FROM pg_stat_statements
ORDER BY max_exec_time DESC
LIMIT 10;
Queries with the Most Calls
Lists the top 10 most frequently called queries.
1
2
3
4
5
6
7
8
9
10
SELECT
  query,
  calls,
  total_exec_time / 1000 AS total_seconds,
  mean_exec_time AS avg_ms,
  rows,
  (total_exec_time / calls) AS avg_exec_time_per_call
FROM pg_stat_statements
ORDER BY calls DESC
LIMIT 10;
Queries with the Highest I/O (Buffer Usage)
Shows the top 10 queries with the highest buffer usage, indicating I/O-heavy operations.
1
2
3
4
5
6
7
8
9
10
SELECT
  query,
  calls,
  shared_blks_hit + shared_blks_read AS total_blks,
  shared_blks_hit AS blks_hit,
  shared_blks_read AS blks_read,
  (shared_blks_hit + shared_blks_read) / calls AS avg_blks_per_call
FROM pg_stat_statements
ORDER BY total_blks DESC
LIMIT 10;
Queries with the Most Temp File Usage
Shows the top 10 queries that are using the most temporary storage, which might indicate issues with sorts, joins, or insufficient work_mem settings.
1
2
3
4
5
6
7
8
9
SELECT
  query,
  calls,
  temp_blks_written AS temp_written_blks,
  temp_blks_read AS temp_read_blks,
  (temp_blks_written + temp_blks_read) AS total_temp_blks
FROM pg_stat_statements
ORDER BY total_temp_blks DESC
LIMIT 10;
Conclusion
With PG_STAT_STATEMENTS enabled, you’ll have the tools needed to keep your Azure Postgres database performing efficiently. Start exploring its capabilities and see the difference it can make in your database management.
-
Previous
Seamless Integration: Writing Container Service Data Directly to Azure Blob Storage -
Next
Exposing Neo4j Bolt on AKS Using Kubernetes Ingress