F1 score is equivalent to Dice Coefficient(Sørensen–Dice Coefficient). In the section below, we will prove it with an example.
F1 Score
Definition :
Harmonic mean of the test’s precision and recall.
The F1 score also called F-Score / F-Measure is a well-known matrix that widely used to measure the classification model.
F1 scores are biased to the lowest value of each precision and recall. So, when F1 score is increased, both the precision and recall will get increased and balanced.
Dice Coefficient
Dice Coefficient, also known as Sørensen–Dice coefficient or Sørensen–Dice index. It is a statistic matrix that’s used to measure the similarity of two samples.
Discussion
In this section, we will take image segmentation as an example.
Let’s say we have a model that will classify apple.
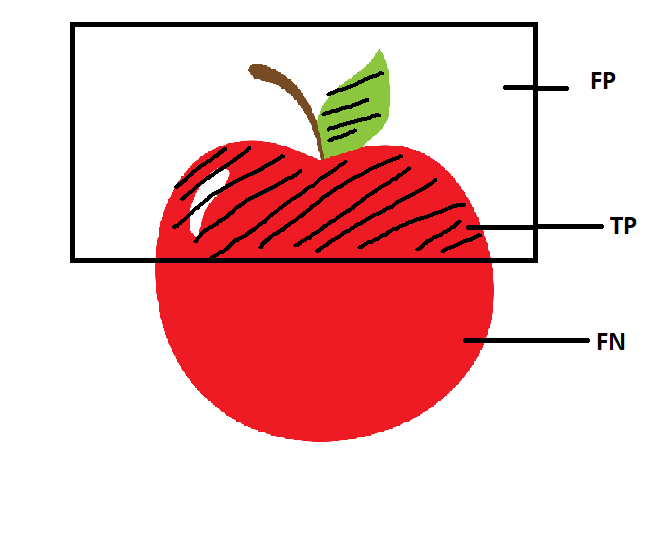
The box area in the image above is where the area that the model predicts it as an apple. We can tell that the box is not covering the whole apple, so meaning that the model has made some mistakes. If we would evaluate using the contingency table, we could break it into:
-
True Positive (TP) - The shaded or intersection area in the image above is the area that correctly predicted by the model.
-
False Positive (FP) - The white area inside the box.
-
True Negative (TN) - The white area outside the box.
For F1 Score, the formula is defined as below:
1
2
3
4
5
               1
F1 = ---------------------
        1           1
     --------- + --------
     Precision    Recall
Precision is defined as:
1
2
3
               TP
Precision = --------
             TP + FP
Recall is defined as:
1
2
3
               TP
Precision = --------
             TP + FN
With the substitution of precision and recall into F1:
1
2
3
           TP
F1 = ---------------
      2TP + FN + FP
While dice is defined as following:
1
2
3
         2 x Intersection
Dice = ---------------------
        Union + Intersection
We know that :
Unionis equal toTP + FN + FPIntersectionis equalTP
By substituting the above into dice formula and we will get the same formula as F1.
Reference
[Youtube] Image Segmentation Loss: IoU vs Dice Coefficient
